New in this release · Critical path · Schedule to the minute
The Gantt chart that lives inside Excel.
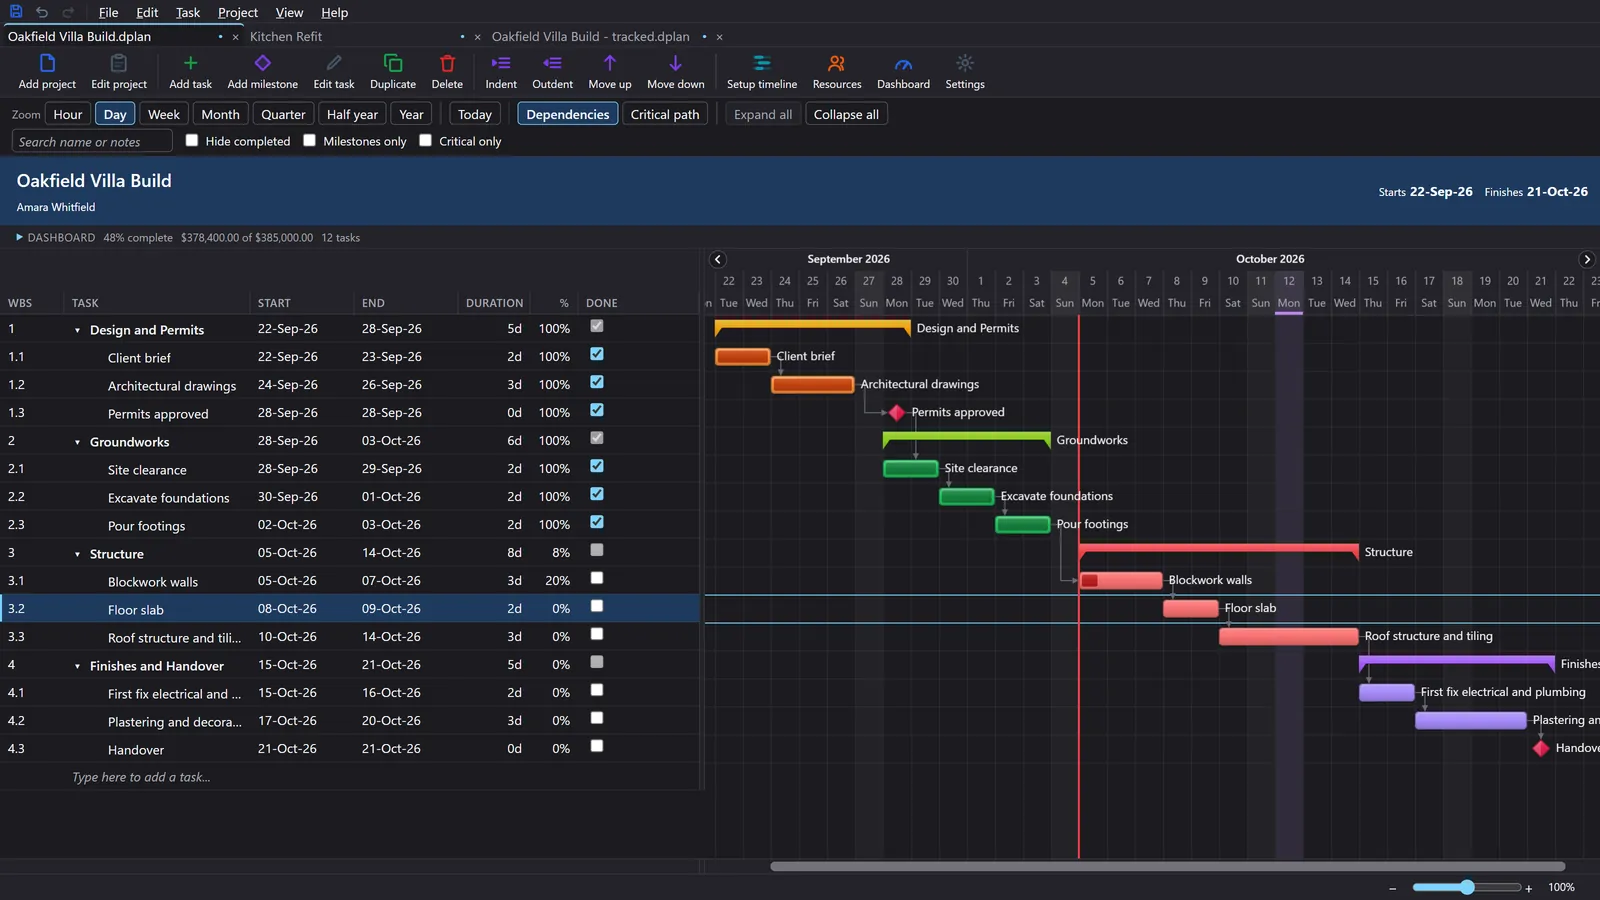
A free Gantt chart Excel template that does the scheduling for you. Add your tasks and link them. When something slips, the dates after it move, the critical path recalculates and progress rolls up on its own. It all happens inside the Excel you already have, with no subscription and no new tool to learn.
- 4.9/5 customer rating
- 8,960,000+ downloads
- Windows & Mac
- 11 languages

What you get
A real project planner, in a file you already know how to open
It stays on your computer. Anyone you send it to can open it. Nothing to log into.
-
Dependencies that move your dates
Link tasks once. Move one date and every task linked after it moves too, so you never drag bars or retype dates.
-
Critical path & float
See the chain that decides your finish date, and exactly how much room every other task has.
-
Hours to years
Seven views, one click apart. Hourly charts schedule to the nearest whole minute.
-
Baselines & actuals
Compare the original plan, today's estimate and what really happened, side by side.
-
Resources & costs
Assign people, set each one's working calendar, and track budget in the same sheet.
-
Dashboard & export
One click to a dashboard, a web report, or a PDF for people who don't live in Excel.
The ribbon
Everything lives in one Excel tab
Gantt Excel adds a single Gantt Excel tab to the ribbon you already use. Build the chart, add tasks and milestones, switch views, assign resources and export without ever leaving the spreadsheet.

Try it yourself
Interactive demo: take the guided tour below
Explore a real project below. Hover any task, milestone or numbered marker to see what Gantt Excel does: dependencies, the critical path, budgets, resources and live dates, all inside your spreadsheet.
Auto-scheduling
Move one date and the linked tasks move with it
Link your tasks once. When a task slips, Gantt Excel works out the new dates for every task that depends on it.
- Finish-to-start, start-to-start, finish-to-finish and start-to-finish links
- Lag and lead time on any link
- Summary tasks roll up their children automatically
- Each resource’s working calendar is used, so weekends and holidays are skipped
Critical path
Know which tasks you can’t afford to slip
Switch on Show Critical Path and every task with no room left gets a red outline. Everything else gets a number telling you exactly how much room it has, so you know which tasks to push and which can wait.

-
Five extra columns
Turning it on adds five read-only columns: Late Start, Late Finish, Total Float, Free Slack and Critical. The two above are the ones you’ll read most: how much room a task has, and whether it has any at all.
-
When a task is critical
A task is critical when its Total Float is zero. The Total Float column is on the sheet, so you can check any task yourself.
-
Red arrows on the critical path
Dependency arrows turn red only when both linked tasks are critical. An arrow running into a task that still has float keeps its normal colour.
-
Float follows working calendars
Float is measured against each resource’s own working calendar. A gap over a weekend or a holiday does not count as spare time.
Dashboards
One click turns the plan into a status report
Press Dashboard and pick your format: a standalone web page you can send to anyone, or a dashboard built inside the workbook. Both read the plan you already have, and neither needs setting up.

A single HTML file. It opens in any browser, on any machine, with nothing installed and no account to create. It carries the cost summary, resource load and milestone list that don’t fit on a Gantt chart.

Built inside the workbook, with live slicers for status, priority and resource. Filter it and every chart follows. It never leaves the file.
Plan and track
Your original plan, next to what really happened
Save a baseline once. From then on the chart carries three sets of dates at the same time: what you committed to, what you now expect, and what really happened. You can see where the plan slipped without working it out from memory.

- Baseline: what you committed to
- Estimated: what you expect now
- Actual: what really happened
- Milestone
-
Save it once
Set the baseline when the plan is agreed. Everything after that is measured against it, so nobody has to remember what the original date was.
-
Three bars, one row
Baseline, estimate and actual sit on the same line. A late task is easy to spot without reading a variance column.
-
Milestones
Mark the dates that matter and see whether they move. Build a milestone-only chart for the people who only need the headlines.
By the hour
Plan by the hour as well as by the day
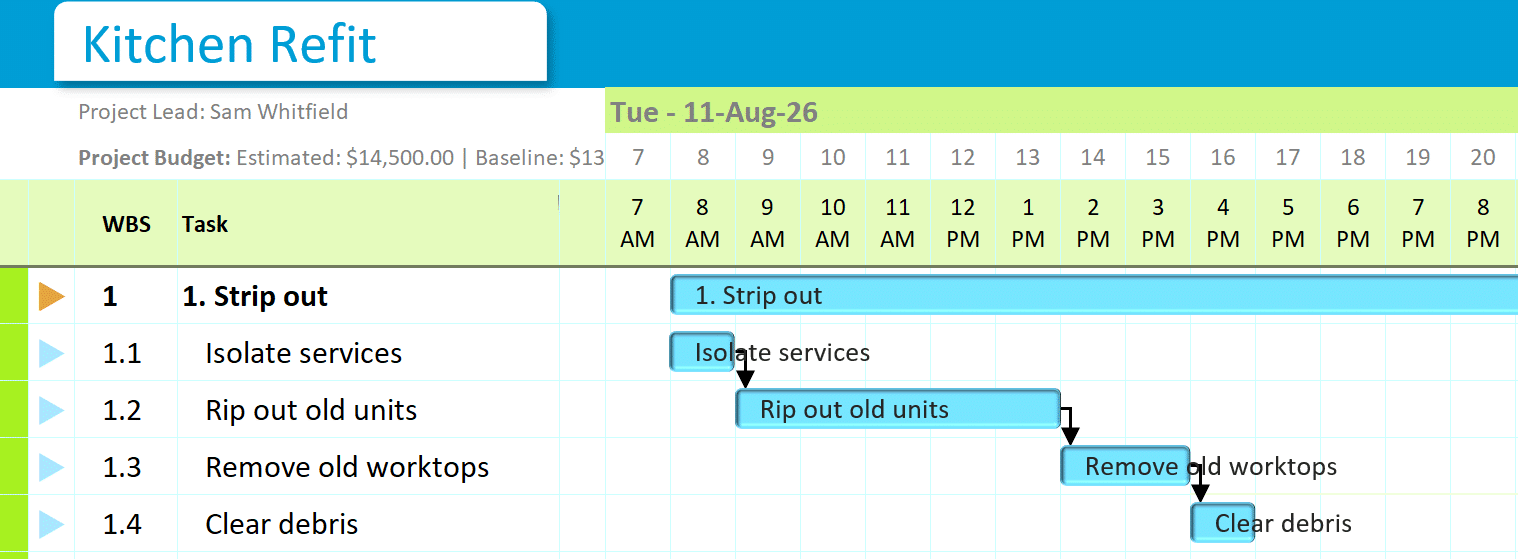
Some jobs are measured in hours: a shift, a cutover window, a day on site. Start an hourly chart and every task gets a start time and a finish time as well as a date, with one timeline column per hour.
-
A time of day for every task
Choose hours when you create the chart. Each task then has a time of day, and the timeline counts in hours.
-
Down to the minute
Durations are kept to the nearest whole minute. A 78-minute job stays 78 minutes.
-
Working hours for each person
Give each resource a start time, an end time and a break. Work that runs past the end of the day carries on the next working morning.
Languages
Gantt Excel in eleven languages
Change it in Settings and the whole interface follows: ribbon, tooltips, dialogs, column headers and dropdowns. Your project stays as you wrote it: task names, notes and resource names are never translated.
- English
- Español (España)
- Español (Latinoamérica)
- Français
- Português (Portugal)
- Português (Brasil)
- Deutsch
- Nederlands
- Italiano
- 日本語
- 简体中文
Before you download
Is Gantt Excel free?
Yes. The free download is a real working workbook that you keep, with no expiry and no account to create. Gantt Excel Pro is a one-time purchase that adds unlimited tasks and projects, the critical path, resources and costs, baselines and the dashboard.
Does it work on a Mac?
Yes. Gantt Excel runs in Microsoft Excel on Windows and on Mac.
Do I need to install anything?
No. Gantt Excel is an Excel workbook, not an add-in. Open the file, enable macros when Excel asks, and the Gantt Excel tab appears in the ribbon.
How is it different from a normal Excel Gantt chart template?
Most Excel Gantt templates are coloured cells that you move by hand. In Gantt Excel you link tasks, and when one date moves, every task after it moves too, skipping weekends and holidays. The bars redraw themselves, so the chart always matches the dates.
Learn
Everything about Gantt charts
Guides written over ten years of answering the same questions. Start wherever you are.
Start here
Templates
Open it in Excel and see
Download it, open it, and have a working project plan in a few minutes. No account to create and nothing to learn first.
Works in Microsoft Excel, on Windows and Mac.